This holiday break has given me time to dig into the music transcription models that we trained and used in 2016-2017, and figure out what the ~6,000,000 parameters actually mean. In particular, we have been looking at the “version 2” model (see parts 1, 2, 3, 4 and 5 of this series), which generated all of the 30,000 transcriptions compiled in ten volumes, as well as helped compose a large amount of new music, including the lovely fourth movement of Oded Ben-Tal‘s “Bastard Tunes”:
The last part of our exploration looked at another specific transcription. We looked at how much the generated transcription copied from the training transcriptions, and found some but not excessive overlap. We looked at the posterior distributions over the generation steps and saw some interesting things, e.g., mirrored probability mass in the pitch tokens. We looked at the hidden state of the third LSTM layer over the generation steps and saw some other interesting properties, e.g., very sparse activity overall, some units activating only once, some units nearly always saturated, and some units emitting a periodic sequence. Our spectral analysis of the hidden state sequences of the third LSTM layer shows that sequences emitted by many unts are similar, including harmonics with a fundamental period of 9 steps. This fundamental period seems to correspond with the output of the bar tokens. At the end, we asked how things will change if we have the v2 model generate another C-major 4/4 transcription. Will the behaviours stay the same? What will happen when we intervene on the dimensions of the hidden state that exhibit a 9-period sequence? Will the system not be able to correctly output measure tokens? Also, do the sequences produced by the units on the other two LSTM layers exhibit such periodicity?
After I initialised the v2 model with a new random seed, it generated the following transcription:
M:4/4
K:Cmaj
A D D E F 2 A c | G A (3 B A G c B A G | A D D 2 F E D C |
D E G A B G E G | A D D 2 F E F A | G B c d c e d c |
A G A B c B A G | A c G E D 2 C 2 :|
d c d e c 2 A G | A d d c d e e d | c c d e c A G A |
A G F G D 4 | d c d e c 2 A G | A d d e c d e g |
f e d f e d c A | G E C E D 2 C 2 :|
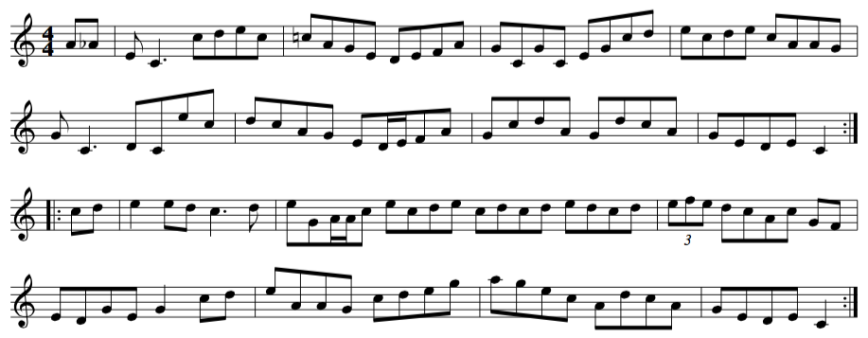
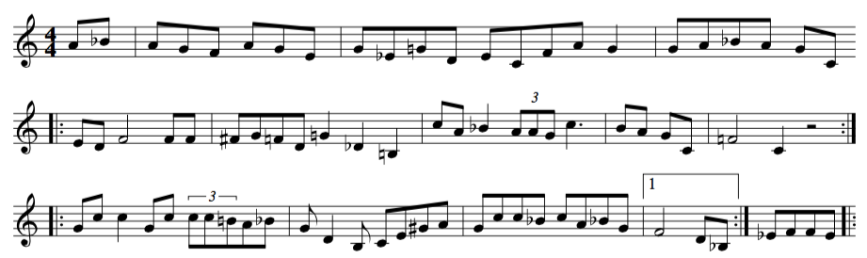
In common practice notation, this appears like so:

All measures are correctly counted. This transcription features two repeated 8-bar parts (“tune” and “turn”). The transcription is missing a repeat sign at the beginning of the first and second parts — but human transcribers would probably make such an omission. There are a few peculiar things here though. The tune is not in C-major, but D-dorian. An inexperienced human ABC transcriber might make the same confusion because the key signatures are the same. Each part ends on C, however, which makes for a surprise having heard D-dorian throughout. There is not much resemblance between the tune and turn. Also, it seems the tune is not composed of two equal length phrases, but one 10-beat phrase answered by a 9-beat phrase, followed by a 13-beat phrase ending with an “question mark” (C). The turn is made of two four-bar phrases, ending in the same way as the tune — perhaps the only strong bond between the two parts.
Again, I would make several changes to this transcription to improve it, but here’s my rendition of the tune on the Mean Green Machine Folk Machine:
It kind of sounds medieval to me … trancriptions of which do exist in the model’s training data. Let’s see what the network is “thinking” as it generates this output.
First, I find little similarity between this generated output and any of the 23,646 training transcriptions.
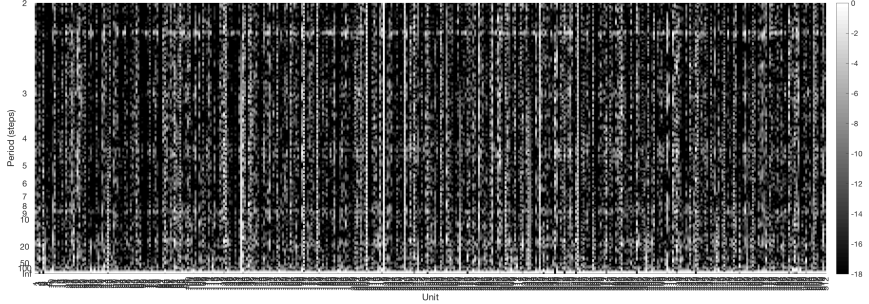
Next, here’s a picture of the softmax output:
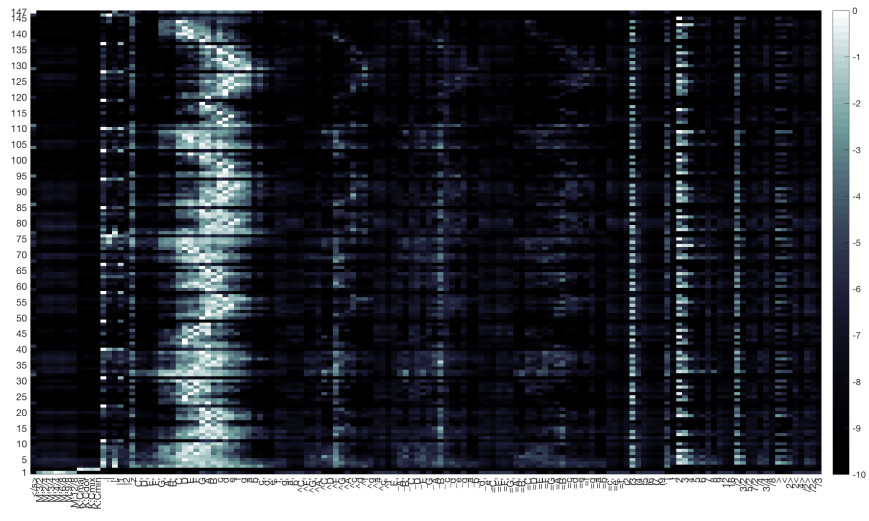 As before, we see a mirroring of probability mass in the pitch tokens with accidentals. We can see a lot of probability mass on the measure tokens every 7-11 steps. We can see probability mass is distributed across several pitch tokens at the beginning of the two phrases — but also around the middle and ending of the first phrase. The final two pitch tokens of the second phrase seem quite certain. We also see probability mass given to the triplet grouping token “(3” throughout the generation.
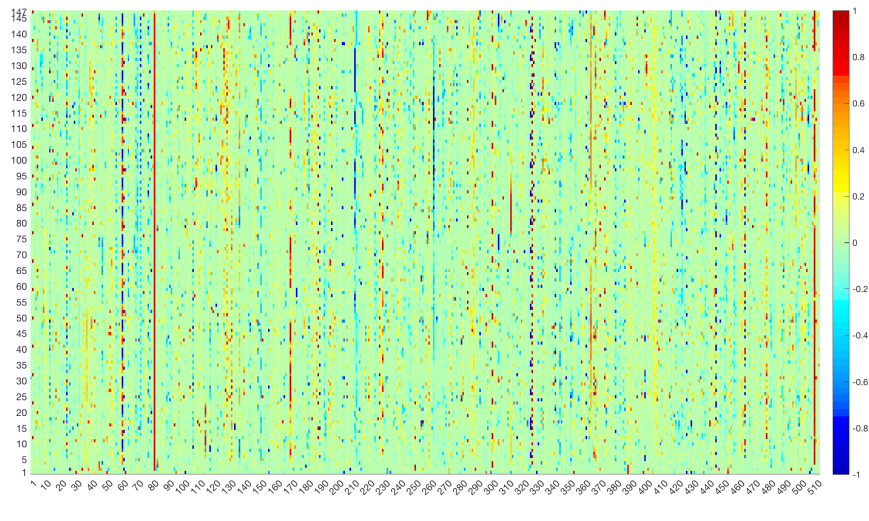
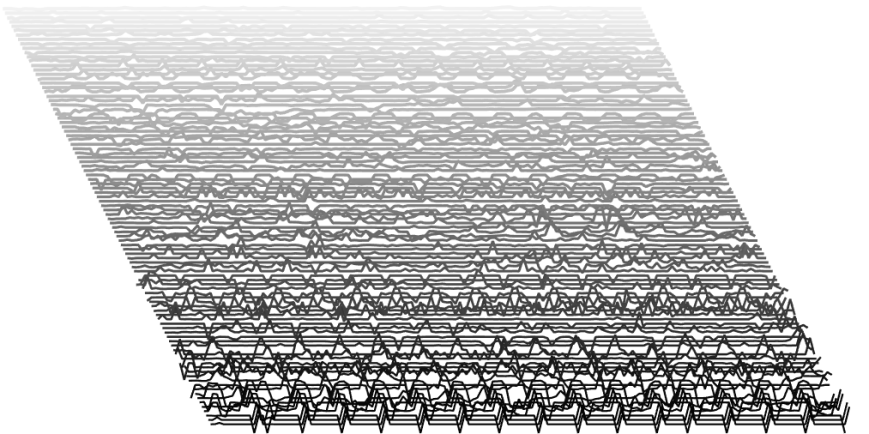
Visualising the hidden state of the third LSTM layer as the sequence steps shows a picture similar to before:
 Here is the plot from before:
 We see similar behaviours in several units, e.g., 60, 81, 300, 325, 326, 445, 464, and 509. Overall, the activations remain quite sparse:
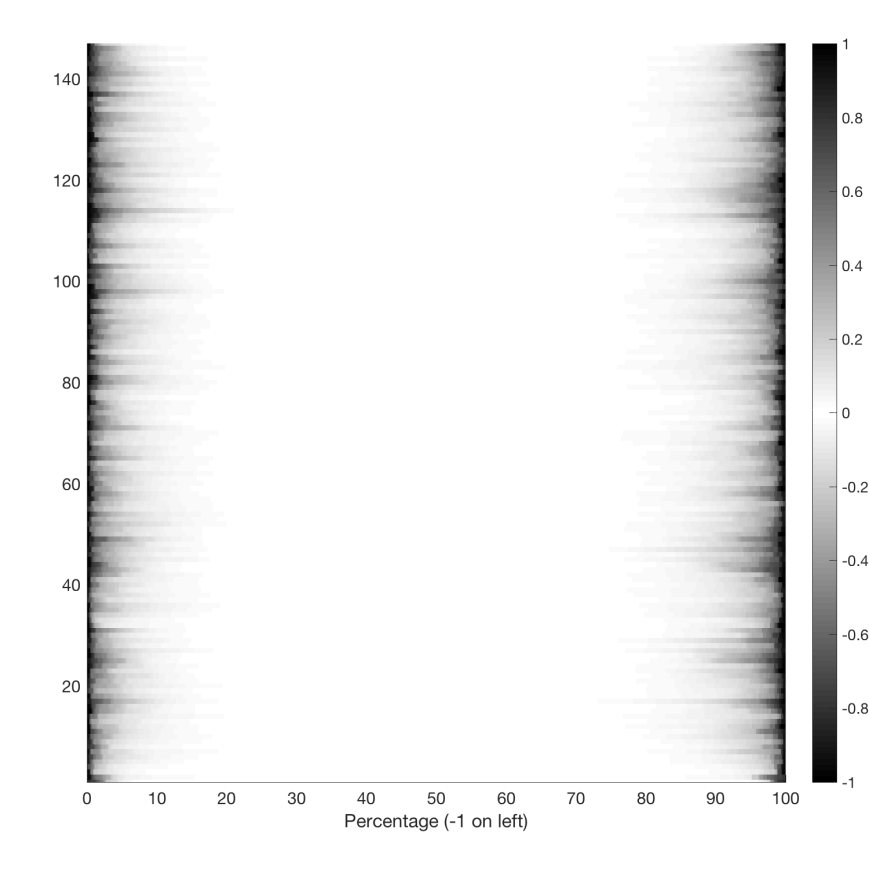
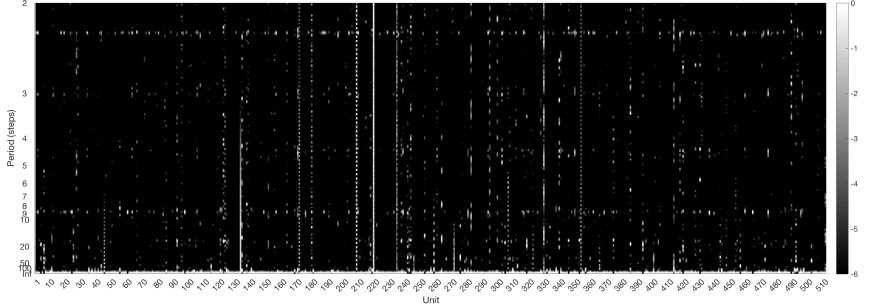
A Fourier analysis of the output sequences produces the following spectra (the magnitude spectrum of each sequence is normalised by its maximum value, and not the maximum value of all spectra combined):
 Here is the one from before:

This shows some clear differences. We still have some periodicity at 9 steps, but it is not as strong as before. This difference is also evinced by the odd-lengthed phrases in this transcription.
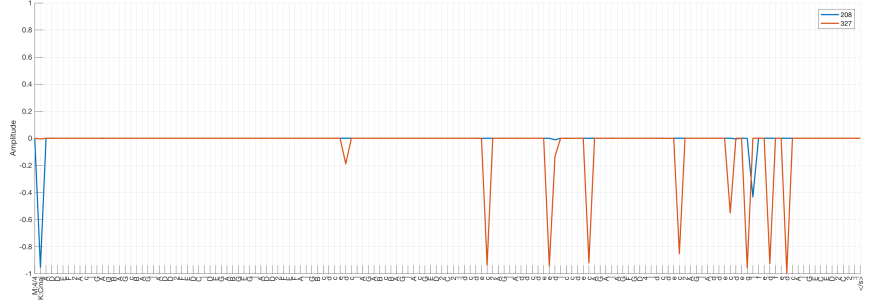
Let’s look at the outputs of the same units we inspected last time. Units 208 and 327 output single spikes last time. Now their outputs are quite different:
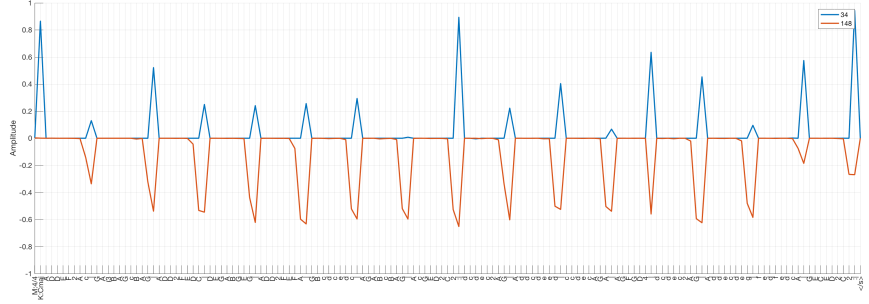
Units 34 and 148 output rather periodic sequences last time, which they continue here:
And units 60, 156, and 203 produce output that looks quite similar to what they produced last time:
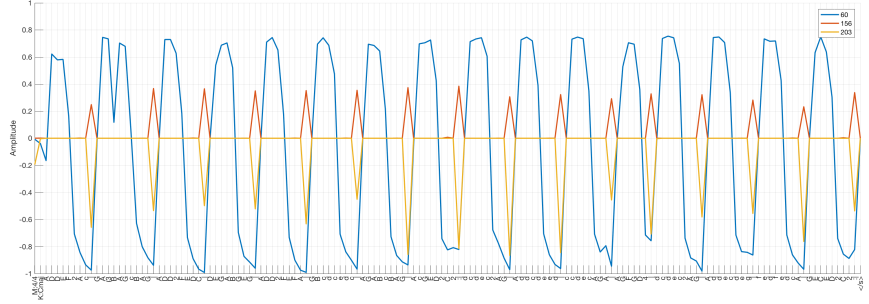
So, it seems some things have changed, but others have not.
Let’s go a bit further now and find the units producing a sequence exhibiting a significant amount of power at a period of 9 steps. Here are the magnitude spectra of the sequences from units that have 5% of their power in the 5 bins corresponding to periods between [8.7, 9.3]. Here’s the spectra of the sequences of those 96 units:
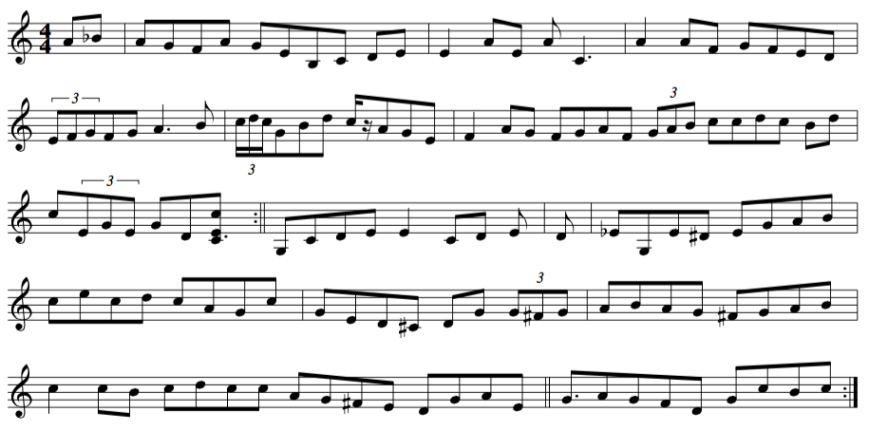
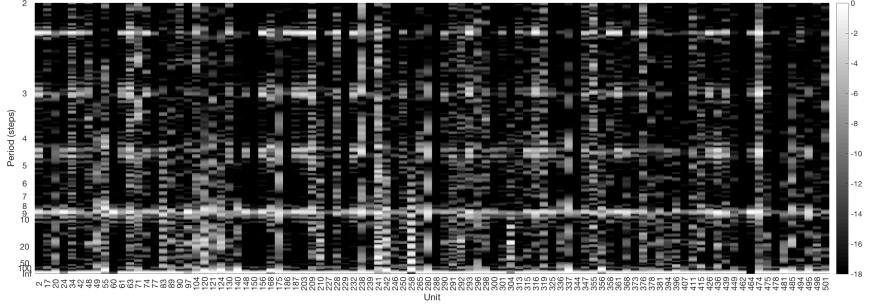 Here are the sequences produced by these 96 units:
And here’s the spectra of the sequences of the remaining 416 units:
In the latter we can still see some power around a period of 9 steps, but there is more power in frequencies having a period of about 2.25 steps.
Now let’s do something dramatic. For the 96 third layer units that have produced a sequence having a period of 9 steps, we will snip their connections to the softmax layer and run the generation procedure again with the same random seed. In essence, this entails setting to zero 49,152 values in 
M:4/4
K:Cmaj
A _A | E C 3 c d e c | =c A G E D E F A | G C G C E G c d |
e c d e c A A G | G C 3 D C e c | d c A G E D /2 E /2 F A |
G c d A G d c A | G E D E C 2 :| |: c d | e 2 e d c 3 d |
e G A /2 A /2 c e c d e c d c d e d c d | (3 e f e d c A c G F |
E D G E G 2 c d | e A A G c d e g | a g e c A d c A |
G E D E C 2 :|
Here’s the dots:
This is a terrible tune from the pickup (which I am not going to learn)! But by golly our lobotomised model can still “count” to a reasonable extent that it has put the measure bars where they belong, save for the 2nd bar in the turn. The model even accounted for the pick ups to both 8-bar sections.
What if we snip all units producing sequences that have 4% of their power in the 5 bins corresponding to periods between [8.7, 9.3]? That adds another 42 units to the blade (cutting a total of 138 units). Here’s the output transcription generated with the same random seed:
M:4/4
K:Cmaj
A _B | A G F A G E B, C D E | E 2 A E A C 3 | A 2 A F G F E D |
(3 E F G ^F G A 3 B | (3 c /2 d /2 c /2 G B d c /2 z /2 A G E |
F 2 A G F G A F (3 G A B c c d c B d | c (3 E G E G D [ C 3 E c ] :|
| G, C D E E 2 C D E | 3/2 D | _E G, E ^D E G A B |
c e c d c A G c | G E D ^C D G (3 G ^F G | A B A G ^F G A B |
c 2 c B c d c c A G ^F E D G A E | | G 3/2 A G F D G c B c :|
Here’s the dots:
 This shows we have now cut a bit too much. The model is losing it’s ability to count. It’s even commiting some errors like putting a duration token before a pitch token, e.g., “| 3/2 D |”.
Snipping all units producing sequences that have 3.5% of their power in the 5 bins corresponding to periods between [8.7, 9.3] adds another 31 units to the blade (cutting a total of 169 units). Here’s the output transcription generated with the same random seed:
M:4/4
K:Cmaj
A _B | A G F A G E | G _E =G D E C F A G 2 | G
A _B A G C |: E D F 4 F F | ^F G =F D =G 2 _D 2 =B, 2 | c
A _B 2 (3 A A G c 3 | B A G C | =F 4 C 2 z 4 :| |: G c
c 2 G c (3 c c =B A _B | G D 2 B, C E ^G A | G c c _B c
A _B G |1 F 4 D _B, :| _E F F E |:
Here’s the dots:
It’s seems to have no problem reproducing the meter and mode tokens, but after that it’s just nonsense. Now only 2 measures are correctly counted. It decides to end the transcription with an open repeat sign.
So, cutting 96 of the 512 connections from the last LSTM layer to the softmax layer does not reduce the model’s ability to produce measure line tokens at the right places. That’s nearly 19% of the connections. However, after snipping 27% of these connections, we see a marked effect on this ability. And increasing this to 33%, the ability nearly disappears.
What if we snip 33% of these connections at random? Here’s the output transcription generated with the same random seed:
M:4/4
K:Cmaj
A 4 G E G c | c F B c _E G C ^C | G, F, D, 2 G, C,
F, ^G, | E, C C D, E, F, 3 | F, E, D, F, E, C, F, G, | E, /2 F, /2 F,
D, C, E, C, E, /2 G, /2 G, | F, G, F, E, C, E, C, C, | A, B, C D C G
F D | G 2 F D _B, E D G, | C G G F E /2 F /2 G F G | f
/2 f /2 d B d c 2 G _E | A, =B, C B, G, F, E, G, | F, D D D, C,
2 C B, | C E G F =E C E G | c c E G E C G G | F =E F
G A G G 2 | G /2 A /2 G F E F G F D | _E G _d c =G f c
B | G 3 B G c G D, | G /2 C /2 C G, G, F, C E, C, | G, _B, A,
D _B, 2 B, d :|
Here’s the dots:
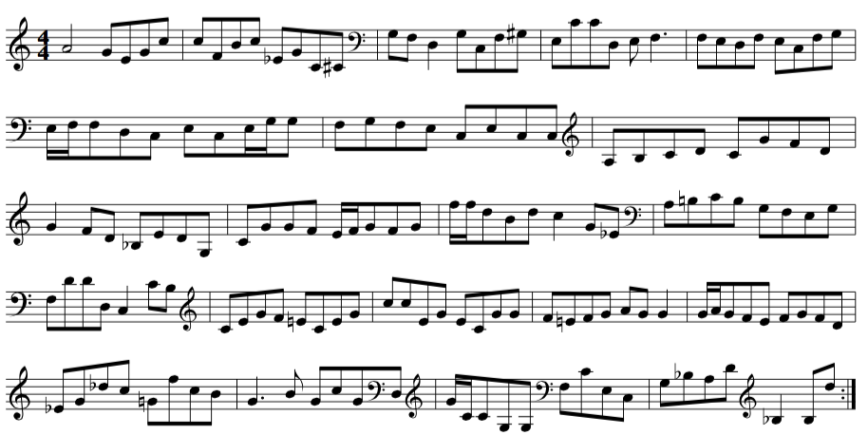
It’s a real dog’s breakfast — there’s very little resemblance to any conventions of folk music, other than some stepwise motion and a few arpeggiations — but at least every measure is correctly counted! Repeating the above shows the same behaviour. So, it appears that our model has a significant amount of redundancy built into it when it comes to outputting the measure tokens at the correct steps. This is not really surprising because we trained the model with 50% dropout, which means for every training batch, only 50% of the connections were active. So, this has nicely distributed some of the “concepts” through the model.
The “concepts” of pitch and melody, however, seem to occupy a much larger portion of the model’s parameters. This makes sense because it is a far more complex thing than counting. Also, the vocabulary has 85 pitch tokens, versus 5 measure tokens and and 25 duration tokens.
Time to go deeper into the network. Stay tuned!

Pingback: Making sense of the folk-rnn v2 model, part 7 | High Noon GMT
Pingback: Making sense of the folk-rnn v2 model, part 8 | High Noon GMT
Pingback: Making sense of the folk-rnn v2 model, part 9 | High Noon GMT
Pingback: Making sense of the folk-rnn v2 model, part 10 | High Noon GMT
Pingback: Making sense of the folk-rnn v2 model, part 11 | High Noon GMT
Pingback: Making sense of the folk-rnn v2 model, part 12 | High Noon GMT